6. Use the DerivativeTutor() to create a plot of
and the first derivative.
(6.6.1)
 and the first derivative.


![with(Student[Calculus1]); -1](images/Maple 19 SVDiff Calc Document Solutions_790.gif)

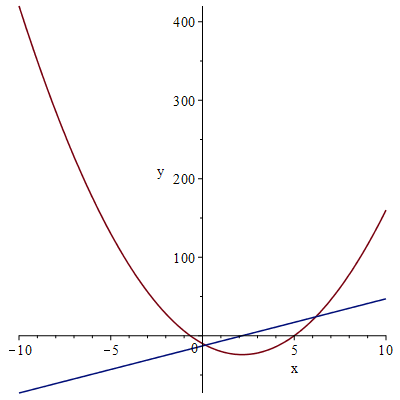 and the first derivative.